

Learn how denial management billing services reduce claim denials, recover lost revenue, identify root causes, and improve your practice’s revenue cycle.
Claim denials quietly drain revenue from healthcare practices every day. Denial management billing services exist to stop that leak. They identify why claims fail, fix the root cause, and recover money that would otherwise be written off. Recent MGMA data show that 41% of providers now report a denial rate above 10%, well past the 5–10% range that HFMA considers acceptable.
The problem is not going away on its own. Payers are tightening prior authorization rules, updating bundling edits, and using AI to flag mismatches that previously went unnoticed. Practices that once absorbed a small denial rate are now watching it climb every quarter. Ignoring it means writing off revenue you already earned.
What Are Denial Management Billing Services?
Denial management billing services are a specialized process that identifies, corrects, and appeals denied insurance claims. The goal is simple: recover revenue and prevent the same denial from happening again. A strong denial management service does not just fix the claim in front of it. It traces the pattern back to its source and closes the gap for good.
Most practices assume denial management only means resubmitting paperwork. That is only half the job. The other half is prevention. Good denial management services build a feedback loop between billing, coding, and front-desk teams. Each denial becomes a lesson the whole revenue cycle learns from.
Denied Claims vs. Rejected Claims
These two terms get used interchangeably, and that mix-up costs practices time. A rejected claim never enters the payer's adjudication system. It bounced back due to a formatting or data error, like a missing NPI number. You simply fix and resubmit it.
A denied claim made it through adjudication. The payer reviewed it and refused payment. This requires a formal appeal, supporting documentation, and often a phone call to the payer. Denial management services are built to handle this heavier lift.
Why does this distinction matter? Because tracking rejections and denials as one bucket hides the real problem. A high rejection rate points to front-end data entry issues. A high denial rate points to coding, authorization, or medical necessity gaps. Different problems need different fixes.
If your practice is ready to reduce denials and recover lost revenue, get a free denial audit and see exactly where your revenue cycle is leaking.
Why Claim Denials Happen: Root Causes Explained
Every denial has a reason code attached to it. Learning to read these codes is the fastest way to understand your practice's biggest vulnerabilities. Denial management services live and breathe these codes daily.
Top Denial Codes and What They Actually Mean
Claim Adjustment Reason Codes (CARC) and Remittance Advice Remark Codes (RARC) explain exactly why a payer denied a claim. Most practices never look past the dollar amount on the remittance advice. That is a missed opportunity.
Code | What It Means | Typical Fix |
CO-16 | Claim lacks information needed for processing | Resubmit with missing data or documentation |
CO-29 | Time limit for filing has expired | Verify payer-specific timely filing rules upfront |
CO-50 | Service deemed not medically necessary | Submit clinical documentation supporting necessity |
CO-97 | Benefit included in another service already paid | Check for bundling or NCCI edit conflicts |
CO-197 | Precertification or authorization absent | Confirm prior authorization before the visit |
PR-1 | Deductible amount not yet met | Verify patient responsibility before billing |
CO-18 | Duplicate claim or service | Audit claim submission logs before resending |
CO-11 | Diagnosis inconsistent with the procedure | Cross-check ICD-10 and CPT code pairing |
Tracking denials by code, not just by dollar value, reveals patterns. If CO-197 shows up repeatedly, your authorization workflow needs fixing, not just your appeals team.
Front-End vs. Back-End Denial Causes
Denials arise at two stages of the revenue cycle, and each requires a different fix.
Front-end causes happen before the claim is ever submitted. These include gaps in eligibility verification, missing prior authorizations, and incorrect patient demographic data. Front-end denials are the most preventable, yet they remain common because they depend on staff catching errors before the visit even happens.
Back-end causes happen during coding and billing. Incorrect CPT or ICD-10 pairing, missing modifiers, and documentation gaps fall into this bucket. These denials require coding expertise to resolve, which is why many practices bring in accurate ICD-10 and CPT coding support rather than handling it alone.
Payers are also raising the bar on back-end scrutiny. Many now run natural language processing tools that compare clinical notes directly against submitted codes before a human reviewer ever sees the claim. High-value categories like imaging, specialty drugs, and surgical procedures are seeing denial rates run 18% to 20% higher than routine office-visit claims, according to recent industry reporting. Vague documentation that once slipped through now triggers an automatic denial. Source: Medical Billers and Coders
Denial Rates by Specialty
Not every specialty faces the same denial risk. Understanding where your specialty typically struggles helps you focus prevention efforts where they matter most.
Specialty | Common Denial Driver | Relative Denial Risk |
Behavioral Health | Authorization limits, medical necessity disputes | High |
Cardiology | Modifier errors, bundling conflicts | Moderate-High |
Orthopedics | Documentation mismatches, prior auth gaps | Moderate-High |
Surgery | Incorrect modifiers, NCCI edit conflicts | Moderate |
Primary Care | Eligibility and coordination-of-benefits errors | Moderate |
Diagnostic Labs | Coding-documentation mismatch | Moderate |
Behavioral health practices consistently see higher denial pressure. Payers apply stricter authorization limits and scrutinize medical necessity more closely in this space. Operationally, practices near the top quartile hold a median net collection rate around 93% and median days in A/R near 40. Source: MedPrecision Billing
In-House vs. Outsourced Denial Management: A Real Cost Comparison
This is the decision every practice eventually faces. Should you build an in-house denial team, or outsource to a specialized service? Both paths carry real costs, and the right answer depends on your claim volume.
The Cost of Managing Denials In-House
Building an in-house denial team means hiring staff, usually one full-time biller per few thousand monthly claims. Add salary, benefits, training time, and denial-tracking software licensing. Many practices underestimate the ongoing training cost as payer rules shift constantly.
There is also an opportunity cost. Staff pulled into denial rework are not focused on new claim submissions or patient collections. Small practices often find this trade-off adds up quickly.
The Cost of Outsourcing Denial Management Services
Outsourced denial management services typically use one of two pricing models. The first is a percentage of collected revenue, usually a small slice of what gets recovered. The second is a flat monthly fee based on claim volume.
Percentage-based pricing aligns incentives well. The service only earns more when it recovers more for you. Flat-fee pricing offers predictability but does not scale down if your denial volume drops.
When Does Outsourcing Make Sense?
Monthly Claim Volume | Recommended Approach |
Under 500 claims | Outsourcing usually costs less than a full-time hire |
500–2,000 claims | Hybrid model, in-house triage plus outsourced appeals |
2,000+ claims | Either model works; compare vendor pricing directly |
Smaller practices almost always come out ahead outsourcing. The break-even point shifts once claim volume grows large enough to justify a dedicated internal team. If your practice sits near that threshold, request quotes from an AR management provider before committing either way.

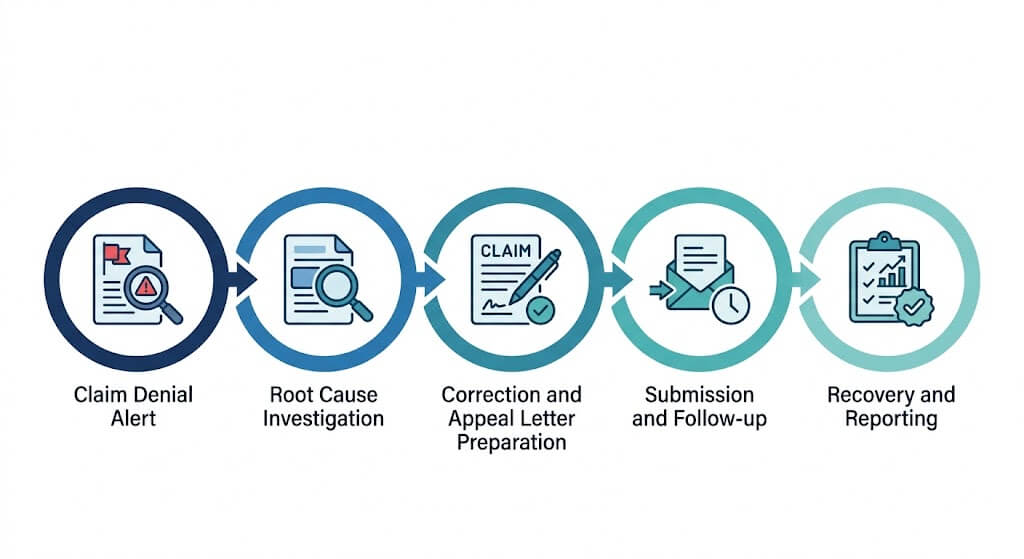
The Denial Management Process, Step by Step
A reliable denial management process follows a consistent structure. Skipping steps is usually why denials resurface month after month.
Detection and triage. Every denial gets flagged the moment it arrives and sorted by urgency and type.
Root cause analysis. The team traces whether the denial stems from coding, authorization, eligibility, or documentation.
Correction or appeal preparation. Simple errors get corrected and resubmitted. Complex denials move into formal appeal preparation.
Submission and follow-up. Corrected claims and appeals go out, followed by persistent payer follow-up until resolution.
Recovery and reporting. Recovered revenue gets posted, and the root cause gets logged to prevent recurrence.
Skipping step five is the most common mistake practices make. Without reporting, the same denial pattern repeats indefinitely.
How AI Is Changing Denial Management in 2026
Denial management has shifted from a purely manual process to one supported by intelligent automation. AI-driven tools now flag denials the moment they arrive, categorize them automatically, and even draft the first version of an appeal letter.
Predictive denial prevention is the newer frontier. Instead of reacting to a denial after submission, AI models flag claims likely to be denied before they ever leave the building. This shifts denial management from reactive cleanup to proactive prevention, which is where the real revenue savings happen.
Practices using AI-supported denial tools report faster turnaround on appeals and clearer visibility into denial trends. The technology does not replace human judgment on complex clinical appeals. It removes the repetitive work so specialists can focus on cases that actually need expertise.

Denial Management ROI: How to Calculate What You're Losing
Most practices underestimate how much revenue sits in denied claims. Here is a simple way to estimate it.
Formula: Denied claims per month × average claim value × appeal success rate = recoverable revenue
HFMA data shows first-level appeals succeed 50% to 70% of the time on appealable denial categories, when practices actually pursue them. For example, a practice with 200 denied claims monthly, an average claim value of $150, and a 60% appeal success rate recovers approximately $18,000 per month through proper follow-up. Multiply that by twelve, and the annual impact of ignoring denials becomes clear. Source: HFMA
Run this calculation with your own numbers. Remember that industry-wide, about 65% of denied claims never get reworked at all. That gap between what is recoverable and what actually gets recovered is where most lost revenue hides.
Denial Prevention Checklist
Prevention costs far less than recovery. Use this checklist to catch issues before claims ever go out the door.
Verify patient eligibility before every appointment
Confirm prior authorization status for all applicable services
Double-check CPT and ICD-10 code pairing before submission
Review modifier usage against payer-specific rules
Audit claims for duplicate submissions before sending
Track timely filing deadlines by payer
Review documentation completeness before coding
Monitor denial trends monthly, not just annually
Choosing the Right Denial Management Services Partner
Not all denial management services deliver the same value. Ask potential partners these questions before signing anything.
How transparent is their reporting? You should see denial trends, appeal success rates, and root cause data monthly, not just a lump-sum recovery number.
Do they understand your specialty? Behavioral health denials differ completely from orthopedic denials. Specialty experience shortens the learning curve significantly.
What technology do they use? Real-time denial detection and automated appeal drafting speed up recovery meaningfully compared to manual-only processes.
How is pricing structured? Confirm whether you are paying a percentage of recovered revenue or a flat fee, and understand what happens to old, written-off claims.
What is the difference between denial management and AR management?
Denial management focuses specifically on claims a payer refused to pay. AR management covers the broader process of collecting all outstanding balances, including denials, unpaid patient bills, and pending claims.
How much do denial management services cost?
Pricing typically runs as a percentage of recovered revenue or a flat monthly fee based on claim volume. Percentage-based models align cost directly with results.
What counts as a good denial rate benchmark?
Denial rates vary by specialty, but practices generally aim to stay in the single digits. Rates climbing into double digits signal a process problem worth investigating.
Can old or written-off denied claims still be recovered?
Yes, in many cases. Timely filing limits vary by payer, and some older claims remain eligible for appeal well past their original denial date. A denial management review often uncovers recoverable revenue practices assumed was lost.
Do denial management services help prevent future denials, not just fix past ones?
Yes. Effective services combine appeal work with root cause analysis, feeding findings back into front-end processes like eligibility checks and coding audits to reduce future denials.
Related Posts

Ophthalmology Medical Billing Services: Costs, Coding Pitfalls, and How to Choose the Right Partner

Oncology Billing Services: How They Work, What The Cost Is, and How to Choose the Right Partner in 2026

What Are Community Rehabilitation Companies? A Complete US Guide to Types, Funding & Billing
Comments (0)
Comments are disabled for this post.